

In 2022, Nevada ranks 17th in Housing affordability. (Photo: Shutterstock)
Report: Las Vegas Home Prices Up 217 Percent Since 2011
Nevada has seen the most dramatic ratio of home prices to wage growth
By Megan Barth, February 20, 2024 2:54 pm
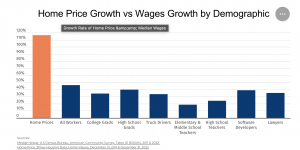
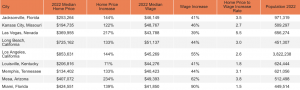
Using data from Zillow and the U.S. Census, a study by TruckInfo.net found that from 2011 to the end of 2022, Nevada has seen the most dramatic ratio of home price to wage growth, increasing six times faster than wage increases. In comparison, Florida, Arizona, and Idaho have all seen homes increase 4 times faster than wages.
“From 2011 to 2022, Nevada saw home prices grow six times faster than wages, ranking it first among all states,” the report stated. “Elementary teachers in Nevada have been particularly impacted, with home inflation outpacing their wages by (a rate of) 17.9. Truck drivers in Nevada saw home prices increase 16.9 times faster than their wages.”
“To compare home affordability over time and across geographies, a commonly used metric is the home-price-to-income ratio,” the study stated. “From 1985 to 1999 this ratio was just 2.6. As of 2022, the national home-price-to-income ratio was a staggering 6.7, meaning homes are 2.5 times less affordable today than from 1985-1999.”
The Review Journal reports that “the average price for a home in the Las Vegas Valley currently sits at $400,354, which means since 2011 there has been an overall $253,000 increase in the price of a home over the past 12 years…This means Las Vegas Valley home prices grew 217 percent since 2011, compared to a 39 percent wage growth uptick.”
Supply and demand, combined with double-digit inflation and Federal Reserve-manipulated interest rates, are factors contributing to housing affordability.
As reported by The Globe, the average Nevadan household must spend an additional $13,296 annually just to maintain the same standard of living they enjoyed in January of 2021, right before inflation soared to 40-year highs, according to a recent analysis of government data.
According to a report by CBS News:
Average hourly pay for workers has increased robust 13.6% since January 2021, although that lags the 17% increase in inflation during the same period, according to government data. The main categories requiring heavier spending for consumers simply to tread water: food, transportation, housing and energy, which together account for almost 80 cents of every $1 in additional spending, according to the Republican analysis.
“Middle- and low-income Americans aren’t doing well enough — they are living fragilely on the edge,” said Gene Ludwig, chairman of the Ludwig Institute for Shared Economic Prosperity (LISEP), a think thank whose own analysis found that the income needed to cover the basics fell short by almost $14,000, on average, in 2022.
The study concludes that since 2011, the median home in America has increased by more than $181k while the median wage has only increased by $15.8k.
According to the Cato Institute, 87% of Americans are concerned about housing costs, and 69% worry about their descendants’ ability to purchase a home.


She was the Main Editor from August 2021 to December 2024.
- Illegal Alien Identified As Wrong-Way Driver in Fatal Crash That Killed LVMPD Officer - December 23, 2024
- Senator Rosen Joins Letter Raising Concerns About Pete Hegseth’s Nomination - December 20, 2024
- NV SOS Launches Four Investigations Into 2024 Election Violations - December 20, 2024
RELATED ARTICLES
-
 September 7, 2022
 -
August 18, 2022
-